To make sense of unstructured data, data scientists employ a variety of data science tools, machine learning models, and scripting languages. Tableau models are among the best tools among them and are employed by numerous businesses. The rise in internet usage and data generation is the reason that data science is one of the most popular professional IT courses option in the twenty-first century.
Due to this, a lot of businesses and organizations are searching for knowledgeable data scientists and engineers who can handle these complex datasets with ease and turn them into actionable insights. One of Tableau's biggest benefits is that even non-tech users can utilize it. Through Tableau, users may do Online Analytical Processing and extract data for in-depth study.
Businesses that require a visual representation of data with online analytical processing should use Tableau. It processes data in a clear-cut, logical manner. Therefore, let's examine the tableau in more context and determine its value to data scientists.
Check Out: How To Use Tableau For Data Science?
What Benefits Can Tableau Offer Data Scientists?
The experts that acquire enormous volumes of data, evaluate it, and use it to develop workable plans for a company or organization are known as data scientists. They use methods from various fields, including data science, statistics, machine learning, and others, to develop models.
Following that, these data models are employed to create a relationship between various variables and generate predictions from illogical datasets by using what is known as Tableau.
-
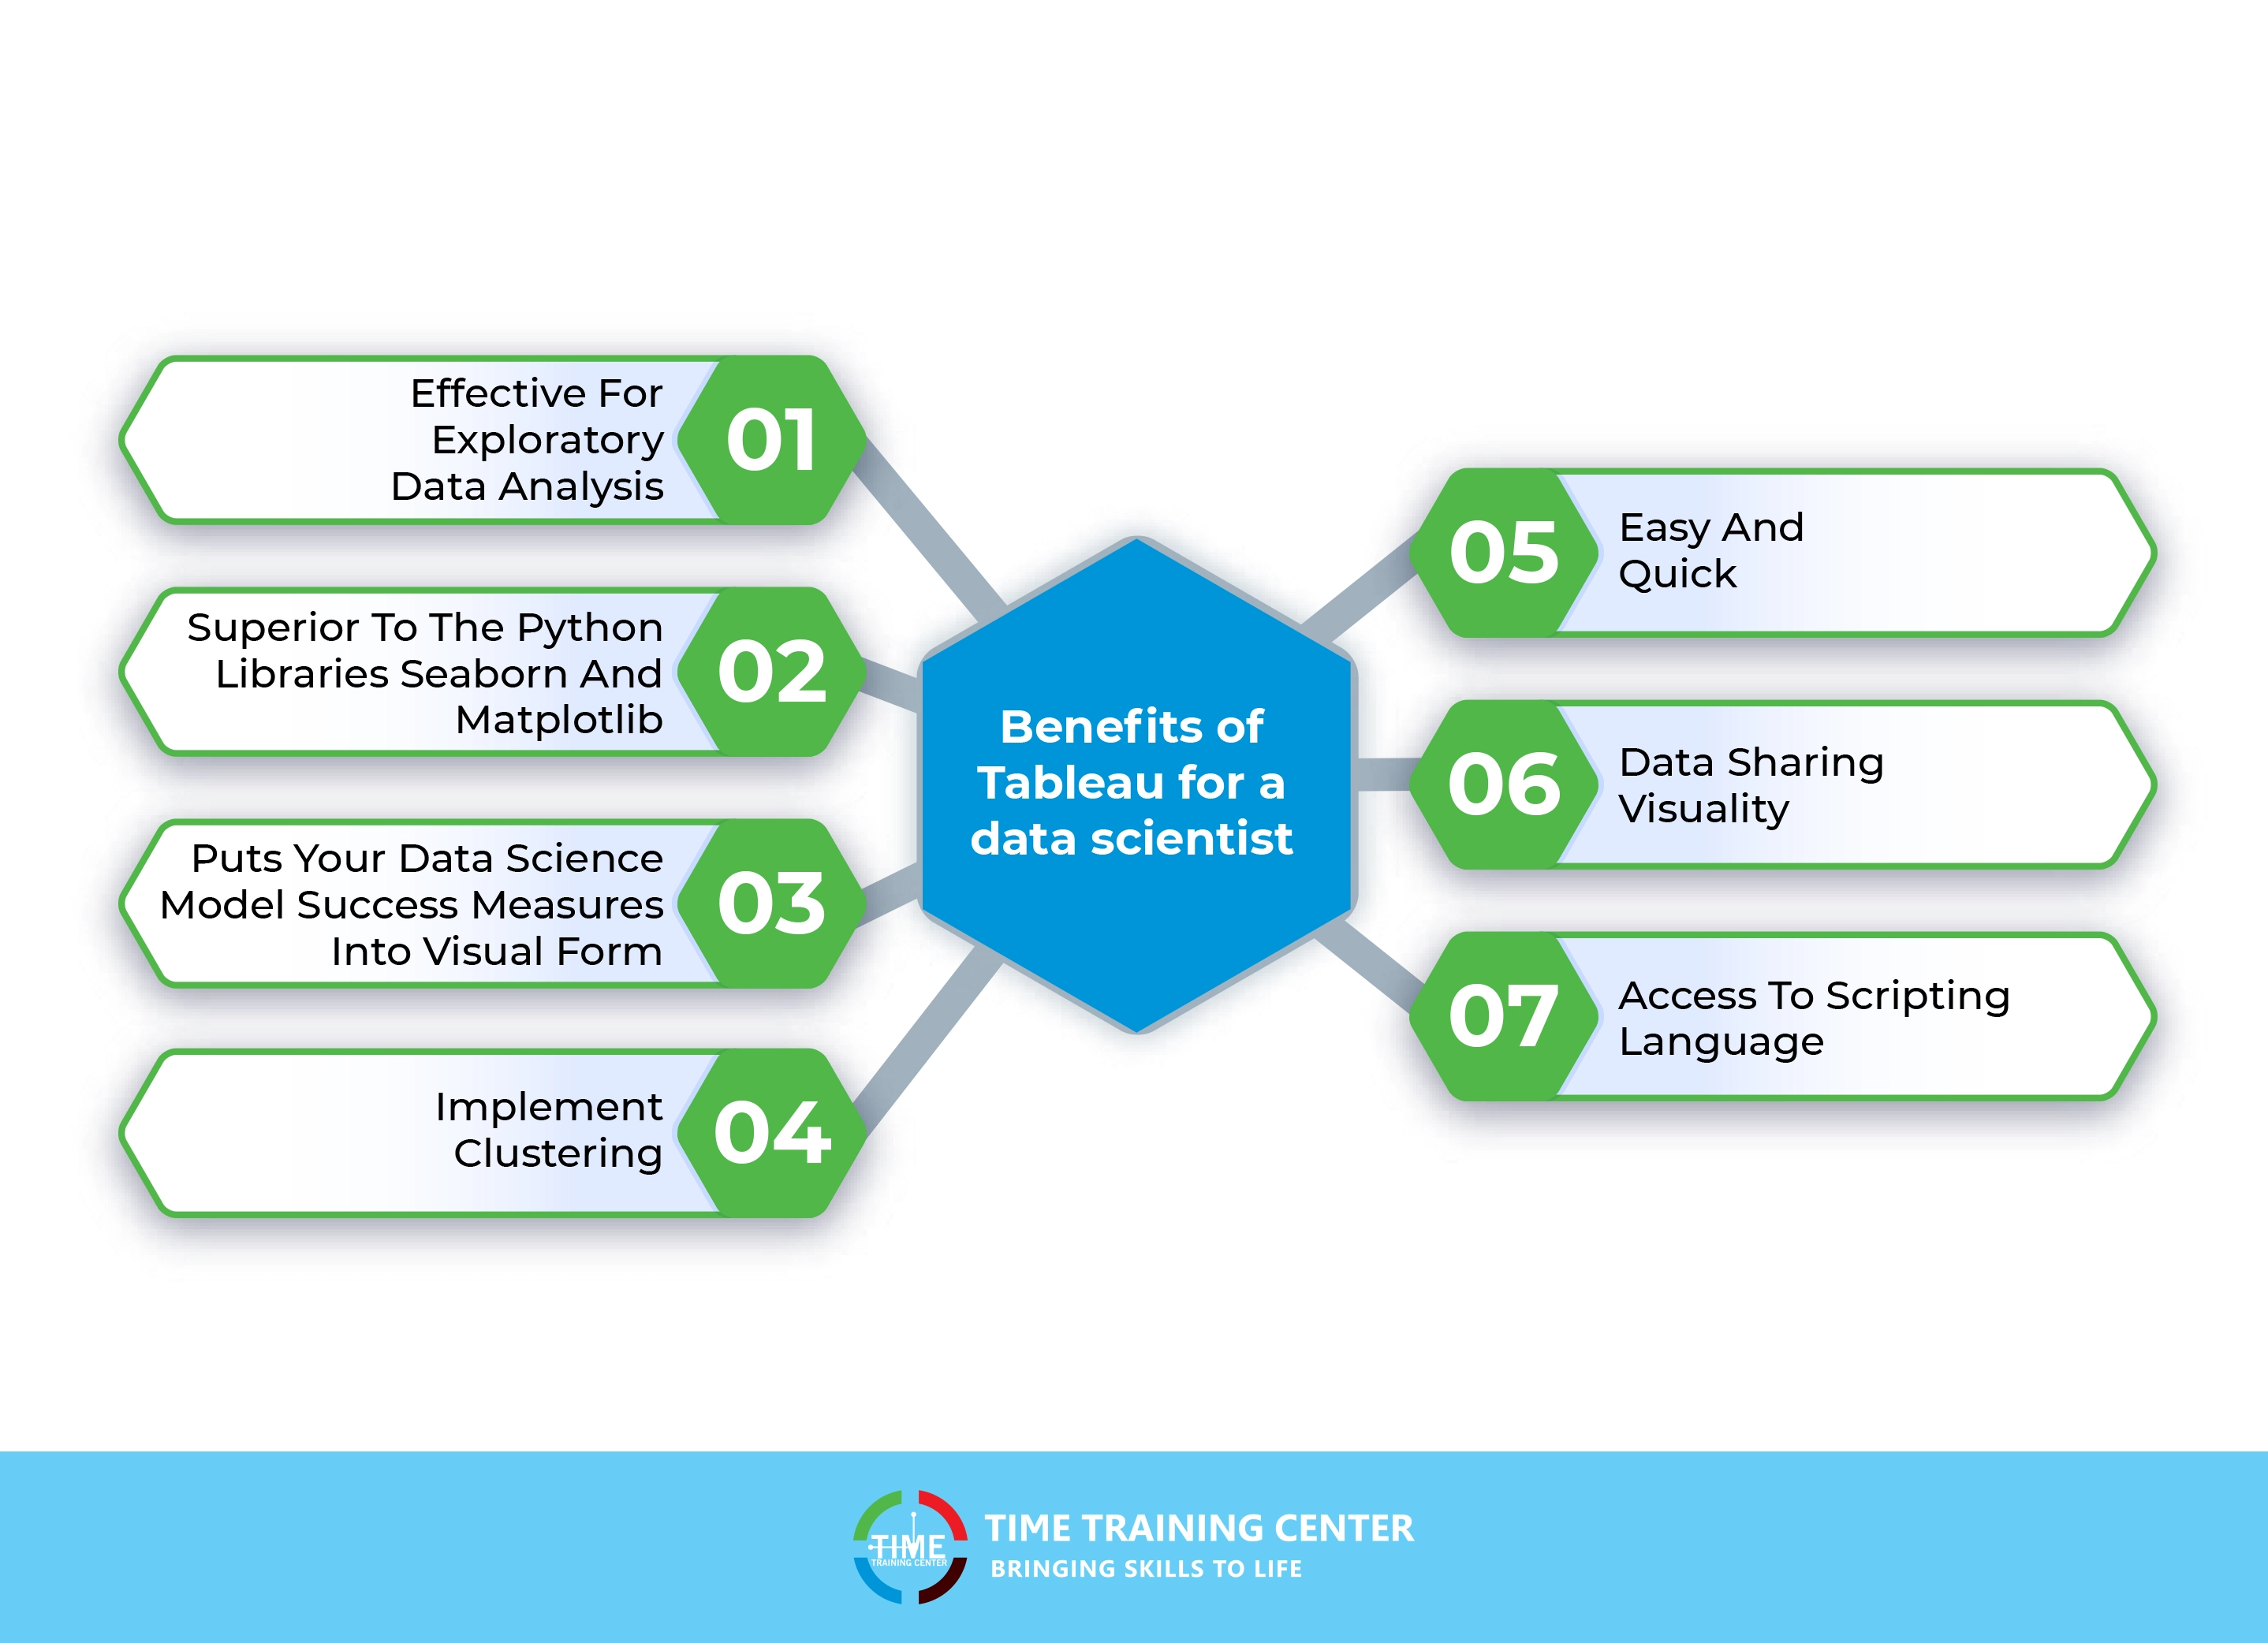
Effective For Exploratory Data Analysis
-
Superior To The Python Libraries Seaborn And Matplotlib
-
Puts Your Data Science Model Success Measures Into Visual Form
-
Implement Clustering
-
Easy And Quick
-
Data Sharing Visuality
-
Access To Scripting Language
-
Effective For Exploratory Data Analysis
EDA, also known as exploratory data analysis, is a crucial step in data science. It is used by data scientists to do the initial analysis of the datasets in order to find anomalies, and hidden patterns, test hypotheses, and validate their presumptions.
This is where it is useful because performing EDA on large datasets requires a lot of time and resources. With Tableau, you can complete many EDA tasks on a single platform in a fraction of the time and with fewer resources. Simply load your datasets from various sources and do various procedures on them.
-
Superior To The Python Libraries Seaborn And Matplotlib
In most cases, you must write numerous Python scripts utilizing various libraries, such as Matplotlib. It's a laborious procedure, and the end result is frequently unsatisfactory. With tableau, you can swap out those ugly charts for detailed and aesthetically pleasing graphics like bullet charts. You can now use the time that you would have otherwise spent developing scripts to engage in other pursuits.
You May Also be Interested in: Why Python is So Popular?
-
Puts Your Data Science Model Success Measures Into Visual Form
With these models, adding performance indicators, confidence scores, and summary statistics for manual evaluation is simple thanks to the SQL database. By doing this, subject matter experts can analyze your reports and make any necessary subsequent modifications.
Also Check: How to Start Your Career as a SQL Developer?
Last but not least, without writing a single line of code, Tableau enables users to perform clustering algorithms like K-means clustering on numerous datasets. Finding commonalities across various client groups using clustering will help you promote your items and create campaigns that are effective.
Tableau can be incredibly rapid and easy to use, which is a more general benefit. A dashboard can be made quickly if you have a prepared CSV file. This dashboard will have multiple sheets with various visualizations, including maps, charts, and tables. It's really as simple as dragging and dropping fields onto your sheet and choosing a visualization. Let's now discuss how to include certain programming languages.
The ability to utilize Tableau for its primary purpose of sharing data visually may be the tool's most significant advantage for data scientists. As a data scientist, you could run into many types of employees in various divisions inside your business. It is your responsibility to be able to communicate your intricate machine-learning algorithm and its associated findings to others.
Visualizing it is one of the finest methods to accomplish it. Any of the charts can be used to describe the model outcomes, including whether or not you improved the company, which groupings of your data performed better, etc. Tableau has a plethora of applications in data science which has greatly benefited Data scientists.
-
Access To Scripting Language
Users of Tableau can utilize Python to carry out intricate computations, prevent performance problems, and guarantee dashboard optimization. Businesses must use a lot of data in order to run their daily operations. Companies can win by increasing earnings and lowering operating expenses with Tableau and OLAP.
It helps organizations make decisions quickly by making the data dynamic and visually appealing. Innovatively visualizing their data enables enterprises to keep up with the rapidly changing technology and stay ahead of their rivals.
Also Read: Python vs VB, Which is Better for Development Project?
Tableau: Is It Required For Data Science?
Most individuals out there might still be wondering if it's required for data science, the answer to that is "YES". Numerous sectors of the economy and businesses rely on Tableau to gather huge statistics, interpret them meaningfully, and aid in decision-making.
Users from both technical and non-technical backgrounds can utilize the interactive platform it offers to examine the data and build visuals to learn more about the many departments. Some technologies are a better alternative for Tableau in Data Science operations due to their capacity to connect with various data sources.
It enables you to access data in several formats and transforms that data into a single format. Tableau offers a simple dashboard development procedure. Simply drag & drop the variable columns to instantly create dynamic displays. Additionally, by using calculated fields and metrics, the visuals can be customized inexhaustibly just as explained earlier. A Tableau certification can help quite helpful if you are looking for a boost in your career.
You May Also Like: Top Data Professional Tech Jobs
Conclusion
As you've seen, Tableau offers various key advantages for a variety of positions, including those of data scientists. A tableau is a comprehensive tool for the entire Data Science process, whether you just want to drag and drop your data to make a simple exploratory data analysis or build a model from within Tableau.
Tableau's overall performance is solid and safe. It quickly and easily handles massive amounts of data and produces a variety of representations. It's the most appropriate tool for the Data scientist to ease the burden and stress of work off him.
You May Also Like to Read: Guide to Master Machine Learning with Python
 +971 2 6713828