A Gantt chart is used in project management to visually plan, schedule, and track tasks over time. It helps managers see task timelines, dependencies, deadlines, and progress in a clear horizontal bar format, making it easier to coordinate resources and ensure projects are completed on time.
Quick Answer
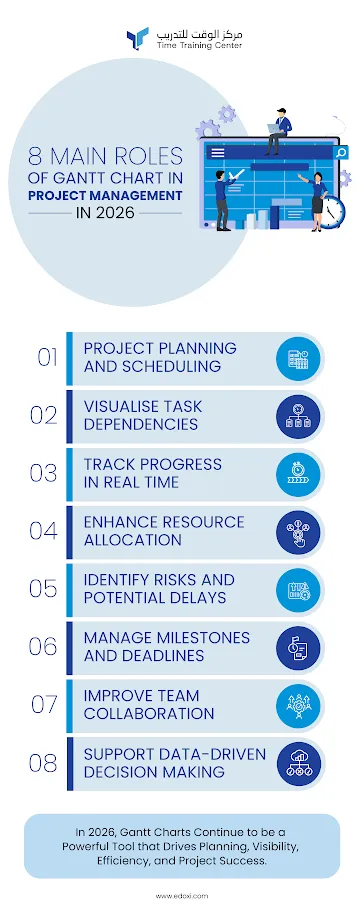
The 8 key roles of a Gantt chart in project management in 2026 are:
-
Strategic Visualisation of Mega-Project Timelines
-
Dependency Mapping and Critical Path Structuring
-
Resource Allocation and Workforce Optimisation
-
Progress Tracking and Real-Time Status Reporting
-
Risk Identification and Early Warning Detection
-
Stakeholder Communication and Alignment
-
Scope Change and Impact Management
-
Integrated Cost–Time Control (Financial Governance Layer)
If you have spent any time in project management or even glanced at a product roadmap, you have almost certainly encountered a Gantt chart. That familiar cascade of horizontal bars stretching across a calendar grid is one of the most enduring planning tools ever created.
Yet despite being over a century old, its relevance has never been greater than it is today. Ever wondered why some teams zip through tasks while others stumble? Often, it comes down to how well they plan. Visual planning tools are huge assets in many fields.
This blog breaks down the full role of a Gantt chart in project management, backed by the latest research, with practical examples, comparison tables, and answers to the questions students and professionals ask me most.
1. What Is a Gantt Chart?
A Gantt chart is a type of bar chart that illustrates a project schedule. It maps tasks on the vertical axis against time on the horizontal axis, with each task represented as a bar whose length corresponds to its duration.
At a single glance, it answers three core questions: what needs to be done, when, and in what order?
Developed by American engineer Henry Gantt around 1910–1915, the chart was originally used to manage factory production schedules during World War I. Today, it is baked into virtually every project management platform, from Microsoft Project and Asana to Jira, Monday.com, and Notion.
2. What Are the 8 Key Roles of a Gantt Chart in Project Management in Abu Dhabi?
Here are the 8 key roles of a Gantt chart in project management in Abu Dhabi:
-
Strategic Visualisation of Mega-Project Timelines
-
Dependency Mapping and Critical Path Structuring
-
Resource Allocation and Workforce Optimisation
-
Progress Tracking and Real-Time Status Reporting
-
Risk Identification and Early Warning Detection
-
Stakeholder Communication and Alignment
-
Scope Change and Impact Management
-
Integrated Cost–Time Control (Financial Governance Layer)
2.1 Strategic Visualisation of Mega-Project Timelines
A Gantt chart transforms fragmented project data into a single executable timeline that aligns all stakeholders across phases.
In Abu Dhabi’s mega-project environment, timelines often span 5–15 years, involving civil works, procurement cycles, approvals, and commissioning stages running in parallel.
How Does Strategic Timeline Visualisation Improve Project Execution?
The strategic timeline visualisation improves project execution in Abu Dhabi by:
-
Converts multi-contract project plans into one unified delivery roadmap
-
Aligns government authorities, consultants, EPC contractors, and suppliers
-
Provides a shared visual reference that reduces interpretation errors across stakeholders
What Do Industry Reports Reveal About the Value of Gantt Charts?
The industry reports reveal that the value of Gantt Charts regarding strategic timeline visualisation for Abu Dhabi projects is:
The Evolution of Project Visualisation in the UAE
Tracking projects in the Emirates used to be tough, with manual reports and lousy communication. Thanks to digital shifts in construction, energy, and tech fields, it's now much easier, offering clearer, real-time updates.
Why Is Timeline Visualisation Essential for Abu Dhabi's Mega Projects?
The timeline visualisation is essential for Abu Dhabi mega projects because:
-
Large infrastructure and urban development programs require coordination across multiple semi-government entities.
-
Without visual timelines, projects suffer from siloed execution and misaligned milestones.
Explore the Top Jobs You Can Get with a PMP Certification in Abu Dhabi and discover where this globally recognised credential can take your career.
2.2 Dependency Mapping and Critical Path Structuring
Dependency mapping and critical path structuring play an important role in project management. Gantt charts map task relationships that define how delays propagate across the entire project system.
Gantt charts really shine in project management for finding the critical path—the shortest time to finish a project. If any task here is delayed, the whole project gets pushed back.
Focusing on these key tasks avoids delays, which is crucial for major projects in Abu Dhabi and Dubai.
How Does Dependency Mapping Improve Project Execution?
The dependency mapping over project execution by:
-
Identifies finish-to-start, start-to-start, and lag-based dependencies
-
Determines the critical path, which controls the total project duration
-
Helps simulate delay propagation across interconnected work packages
What Evidence Supports the Importance of Dependency Mapping and Critical Path Analysis?
The following Evidence Supports the Importance of Dependency Mapping and Critical Path Analysis in Abu Dhabi:
-
Abu Dhabi's Projects and Infrastructure Centre highlights the increasing use of integrated project controls to handle interdependent tasks in big projects. They make dependency mapping and critical path analysis really important for on-time completions.
-
Meanwhile, the Abu Dhabi Department of Municipalities and Transport stresses structured critical path planning for complicated transport and urban development tasks. This helps in coordinating contractors, reducing delays, and sticking to project timelines.
Why Is Dependency Mapping Essential for Abu Dhabi Projects?
Dependency mapping is essential for Abu Dhabi projects because:
2.3 Resource Allocation and Workforce Optimisation
Gantt charts allow PMOs to map resources against time, revealing overuse, underuse, and inefficiencies.
How Does Resource Allocation Improve Project Execution?
Resource allocation improves project execution by:
-
Assigns labour, machinery, and contractors across overlapping activities
-
Detects resource over-allocation in multi-site execution environments
-
Optimises deployment of high-value equipment (cranes, rigs, heavy machinery)
What Evidence Highlights the Importance of Resource Allocation and Workforce Optimisation in Abu Dhabi?
The following evidence highlights the importance of resource allocation and workforce optimisation in Abu Dhabi:
-
The Abu Dhabi Department of Economic Development highlights efficient workforce deployment and resource use in its reports, stressing how crucial this is for the growth of Abu Dhabi’s infrastructure, construction, and industrial sectors.
-
The Abu Dhabi Projects and Infrastructure Centre notes the importance of smart resource allocation and workforce planning in keeping project timelines on track, managing costs, and boosting overall performance on big capital projects.
Why Is Resource Allocation Critical for Abu Dhabi's Large-Scale Projects?
The resource allocation is critical for Abu Dhabi’s large-scale projects, as:
-
Projects often involve multi-contractor ecosystems working simultaneously
-
Equipment and skilled labour are shared across multiple zones, increasing scheduling sensitivity
Milestones help break down big goals into smaller steps. These markers are like checkpoints to keep the project moving. When you hit a milestone, you know your team is on track.
The table below shows how different resource allocation methods help manage your project.
Resource Management method comparison of the Gantt chart with other tools
| Resource Management Method |
Visibility Level |
Primary Benefit |
| Gantt Chart |
High |
Visualises resource allocation across tasks and timelines
|
| Spreadsheets |
Low |
Basic resource tracking and manual updates
|
| Task Lists |
Medium |
Assigns responsibilities to individual team members
|
| Kanban Boards |
High |
Monitors workload distribution and team capacity
|
2.4 Progress Tracking and Real-Time Status Reporting
Gantt charts function as live execution dashboards, not static planning tools.
How Does Real-Time Progress Tracking Improve Project Execution?
The real-time progress tracking improves project execution using a Gantt chart by:
-
Tracks the percentage completion of tasks visually
-
Provides an instant snapshot of project health
-
Reduces reliance on manual reporting cycles and status meetings
What Evidence Supports the Need for Real-Time Project Tracking?
The following evidence supports the need for real-time project tracking in Abu Dhabi:
-
The Abu Dhabi Projects and Infrastructure Centre finished an impressive 71 projects and delivered 80 more worth over AED 16 billion in 2023. Keeping track of all these requires constant monitoring and reporting, which is where Gantt charts come in handy.
-
In 2024, Statistics Centre Abu Dhabi created the Bayaan Platform, giving real-time data and monitoring tools for government decisions. This move shows the city's push for real-time project visibility and data-driven choices.
-
According to recent reports, Abu Dhabi has more than 600 infrastructure projects worth over US$55 billion in the works.
With so many moving parts, Gantt charts are key for project timeline management, tracking and catching any issues before they cause big problems.
Why Is Real-Time Status Reporting Important for Abu Dhabi Projects?
The real-time status reporting is important for Abu Dhabi projects as:
Why Gantt Charts Remain Essential for PMP Professionals in Abu Dhabi?
For those aiming for PMP in Abu Dhabi, keeping high standards is vital. They use structured visuals to meet international quality standards. The role of a Gantt chart in project management helps manage big projects well.
Good project management in Abu Dhabi needs both technical skills and strategic thinking. Using these charts helps teams stay on track and manage resources well. This approach sets apart the best project managers in Abu Dhabi.
2.5 Risk Identification and Early Warning Detection
Risk identification and early warning detection using Gantt charts expose risk patterns that are not visible in traditional task lists.
How Does Risk Identification Improve Project Execution?
Risk identification improves project execution using a Gantt chart in project management by:
-
Highlights schedule congestion zones
-
Detects missing buffers between dependent activities
-
Identifies overlapping high-risk workstreams
What Evidence Supports the Importance of Early Risk Detection in Project Management?
The following evidence supports the importance of early risk detection in project management in Abu Dhabi:
-
Abu Dhabi's infrastructure pipeline, costing over AED 200 billion, includes lots of moving parts and players. The government uses early warning systems and Gantt charts to spot problems like schedule delays or resource shortages early on.
-
According to the Project Management Institute, organisations with solid risk management wrap up their projects successfully way more often, 2.5 times more frequently than those without.
So in Abu Dhabi, using Gantt charts for risk visibility helps them fix issues promptly and boost overall success for their big infrastructure projects.
Why Is Early Warning Detection Critical for Abu Dhabi Projects?
The early warning detection is critical in Abu Dhabi because:
Learn how to become a Certified PMP Professional in Abu Dhabi with a step-by-step guide to certification success.
2.6 Stakeholder Communication and Alignment
The role of gantt chart in project management is more than just tracking tasks. It gives a clear view of the whole project, keeping everyone on the same page. This is key in fast-paced business settings in the United Arab Emirates.
Gantt charts act as a universal business communication language across technical and non-technical stakeholders, thus maintaining stakeholder communication and alignment.
How Do Gantt Charts Improve Stakeholder Communication During Project Execution?
Gantt charts improve stakeholder communication during project execution by:
-
Translates engineering complexity into visual logic
-
Aligns government bodies, consultants, and private contractors
-
Reduces misinterpretation of scope and timelines
What Evidence Supports the Value of Gantt Charts for Stakeholder Alignment?
The following evidence supports the value of Gantt charts for stakeholder alignment in Abu Dhabi:
Why Is Stakeholder Alignment Important for Abu Dhabi Projects?
Stakeholder alignment is important for Abu Dhabi projects as:
The table below shows how visual scheduling beats old ways of talking:
Benefit level of visual scheduling
| Communication Method |
Transparency Level |
Collaboration Impact |
Efficiency Gain |
| Email Threads |
Low |
Fragmented |
Minimal |
| Static Spreadsheets |
Moderate |
Limited |
Average |
| Gantt Chart Software |
High |
Seamless |
Significant |
2.7 Scope Change and Impact Management
Gantt charts make scope evolution visible across the entire project lifecycle.
How Do Gantt Charts Help Manage Scope Changes During Project Execution?
Gantt charts help manage scope changes during project execution by:
-
Shows the downstream impact of design or requirement changes
-
Visualises delay and cost ripple effects
-
Supports formal change approval processes
What Evidence Supports the Importance of Scope Change Management in Abu Dhabi?
The following evidence supports the importance of scope change management in Abu Dhabi:
Why Is Scope Change Management Critical for Abu Dhabi Projects?
The scope change management is critical for Abu Dhabi Projects because:
The Infrastructure projects often evolve due to:
Discover 5 Amazing Benefits of PMP Certification and how it can enhance your earning potential, leadership skills, and career growth.
2.8 Integrated Cost–Time Control (Financial Governance Layer)
Gantt charts are often integrated with financial tracking systems.
How Do Gantt Charts Support Cost and Schedule Control During Project Execution?
The Gantt charts support cost and schedule control during project execution through:
-
Links the schedule progress with the budget utilisation
-
Supports earned value management (EVM) analysis
-
Tracks cost variance across execution phases
What Evidence Supports the Integration of Cost and Time Management?
The following evidence supports the integration of cost and time management in Abu Dhabi:
-
PMI research indicates that integrated cost and schedule management systems can improve budget forecasting accuracy by 15–20%, enabling project teams to identify cost variances earlier and make better financial decisions.
-
The Abu Dhabi Projects and Infrastructure Centre (ADPIC) promotes integrated project controls across major infrastructure projects to enhance financial accountability, performance monitoring, and governance throughout the project lifecycle.
Why Is Integrated Cost–Time Control Important for Abu Dhabi Projects?
Integrated cost–time control is important for Abu Dhabi projects as:
Conclusion
Effective project delivery comes from turning complex data into useful insights. Learning how to use Gantt charts in project management helps you control your business in the United Arab Emirates. This skill is key to success.
You now know how to make your team work better with deadlines and resources. Using these visual tools keeps everyone focused on your main goals. This focus leads to better results for companies using tools like Microsoft Project or Asana.
Share your experiences with these tools to help others improve. Your feedback strengthens the project management community in Dubai and Abu Dhabi. Start using these strategies today for your future projects' success.
In Abu Dhabi’s project ecosystem, Gantt charts operate as:
-
Execution control systems
-
Risk intelligence frameworks
-
Financial governance tools
-
Stakeholder alignment mechanisms
-
Predictive planning engines
They are central to ensuring that mega-projects remain on time, within budget, and aligned with national development priorities.
Frequently Asked Questions (People Also Ask)
1. What is a Gantt chart used for in project management?
A Gantt chart is used to plan, schedule, and track project tasks on a visual timeline. It shows task durations, dependencies, milestones, and resource assignments, helping teams stay aligned on what needs to be done and when.
2. What are the main components of a Gantt chart?
The core components are: the task list (vertical axis), the time axis (horizontal), task bars showing duration, dependency arrows linking related tasks, milestones (diamond shapes), and resource labels. Advanced charts also include a baseline overlay for comparing planned vs actual progress.
3. Is a Gantt chart suitable for Agile projects?
Yes, particularly at the programme or portfolio level. While sprint-level Agile teams typically use Kanban boards or backlogs, Gantt-based roadmaps are widely used in scaled Agile frameworks (SAFe, LeSS) for quarterly and annual planning.
4. What is the difference between a Gantt chart and a PERT chart?
A Gantt chart focuses on scheduling; it shows tasks on a calendar timeline with durations. A PERT (Program Evaluation and Review Technique) chart focuses on sequencing; it shows tasks as nodes connected by dependency arrows and is better for identifying the critical path in complex projects with uncertain durations.
5. What are the disadvantages of using a Gantt chart?
Key disadvantages include: they can become overly complex for large projects, they require consistent manual updates to remain accurate, they don't communicate task effort or difficulty, and they can give a false sense of certainty if the initial estimates are flawed.
6. What is the best free Gantt chart tool in 2025?
Top free options in 2025 include: ClickUp (generous free tier with Gantt view), GanttProject (open-source desktop app), TeamGantt (limited free plan), and Google Sheets with Gantt templates. For students and educators, Asana's free Education plan is also highly rated.
 +971 2 6713828
1.jpeg)